Cubes and hypercubes are important business intelligence concepts, they contain information that end users will see. Therefore, in this post we will explore a way to visualize a hypercube to gain insight on it. However, we will not explore how and with which tools to calculate it.
Visualizing the cube data structure
To understand the cube data structure, we will use the paradigm explained in the post about Master Data Management. We will use three types of information:
- Business events: Each step of the business process generates an event. When you call a customer, when you sign a contract, when you produce or deliver a product … Events represent actions of the different actors (yourself, customers, suppliers, etc.) involved in your company activity.
- Objects: Objects represent “things” involved in an action. It can physical objects like people or products, or conceptual objects like organization or parameters. For example, a salesman selling a product to the customer, or a supplier delivering raw materials.
- Indicators: Indicators represent a statement of an activity and give you an overview of events in your company. For example, your company’s revenue is the sum of your sales. The client’s claim rate involved the sales event and the customer claims event.
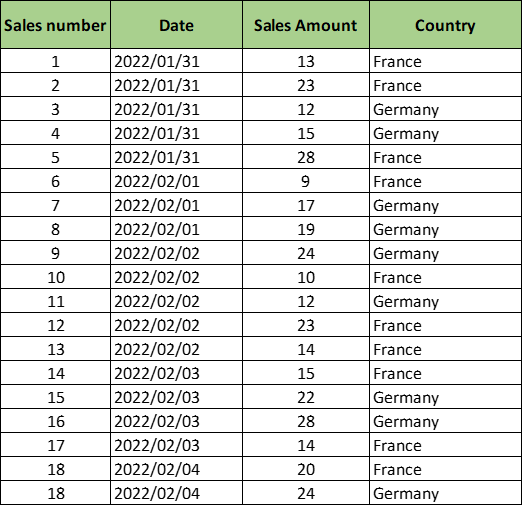
We will use the following example:
- Sales as a business event
- Countries in which sales are made, as an object
- Sales revenue as an indicator
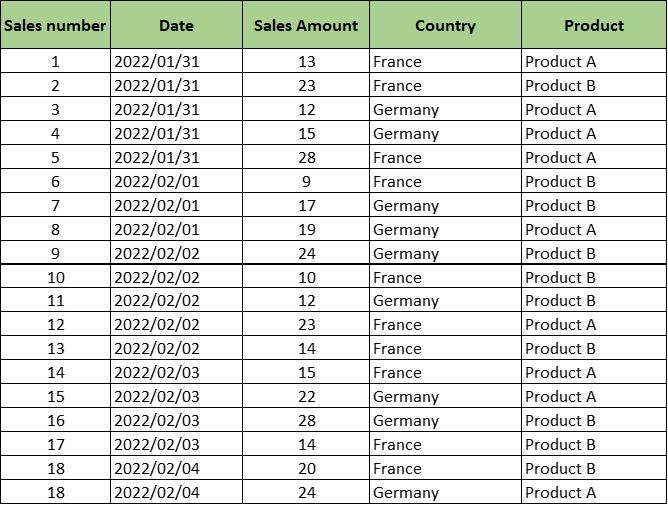
And the following data:
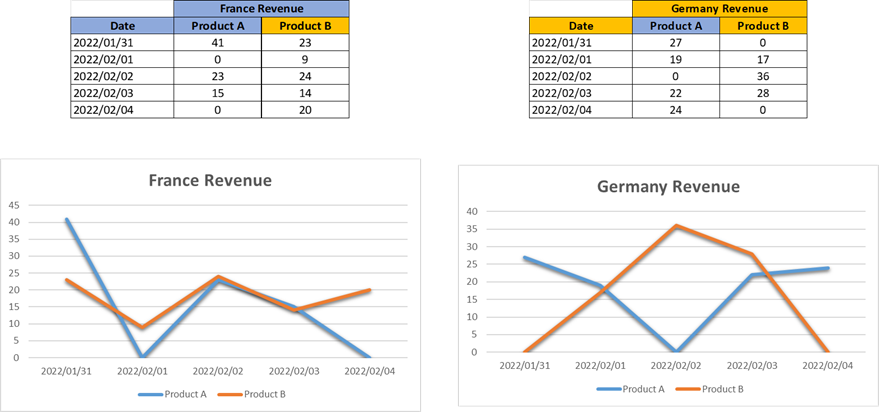
We can first consolidate this data by day and generate three curves that represent:
- Global sales
- Sales for France
- Sales for Germany
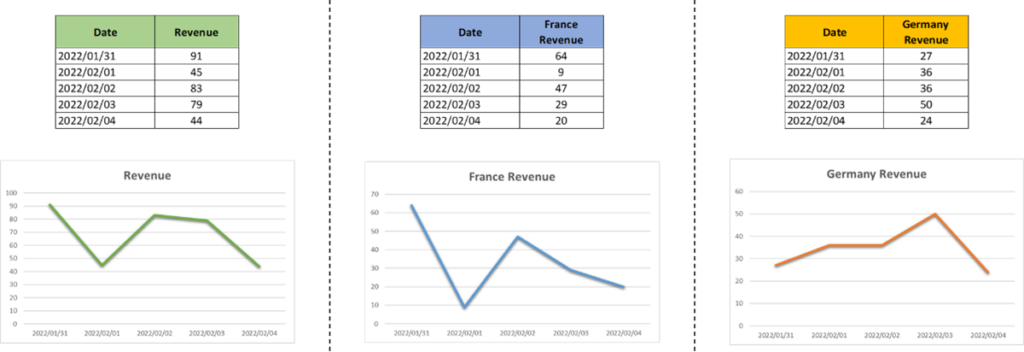
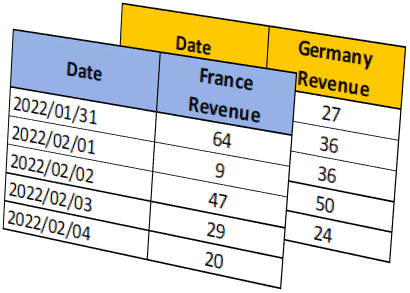
To obtain these three curves, we generate a cube. What is strange is that we generate a cube in two dimensions. The word “cube” is inaccurate and generally refers to the consolidated data storage mode before displaying it to end users. Even though we can represent the data like this:
Visualizing the hypercube structure
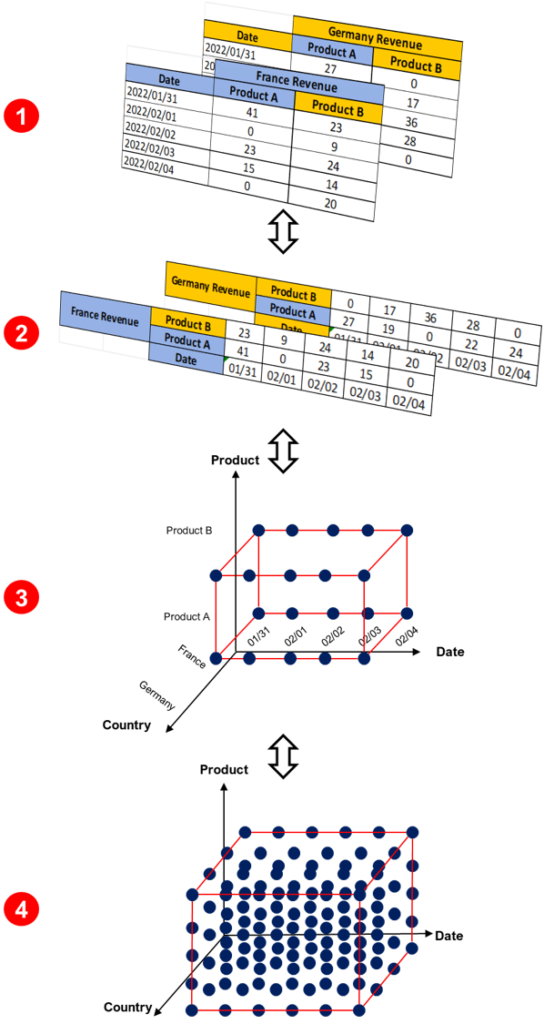
The word “cube” takes on its full meaning in a multi-dimensional case. In our example, we can add a dimension, the product:
And then, we can restart the exercise and consolidate data by country and by product:
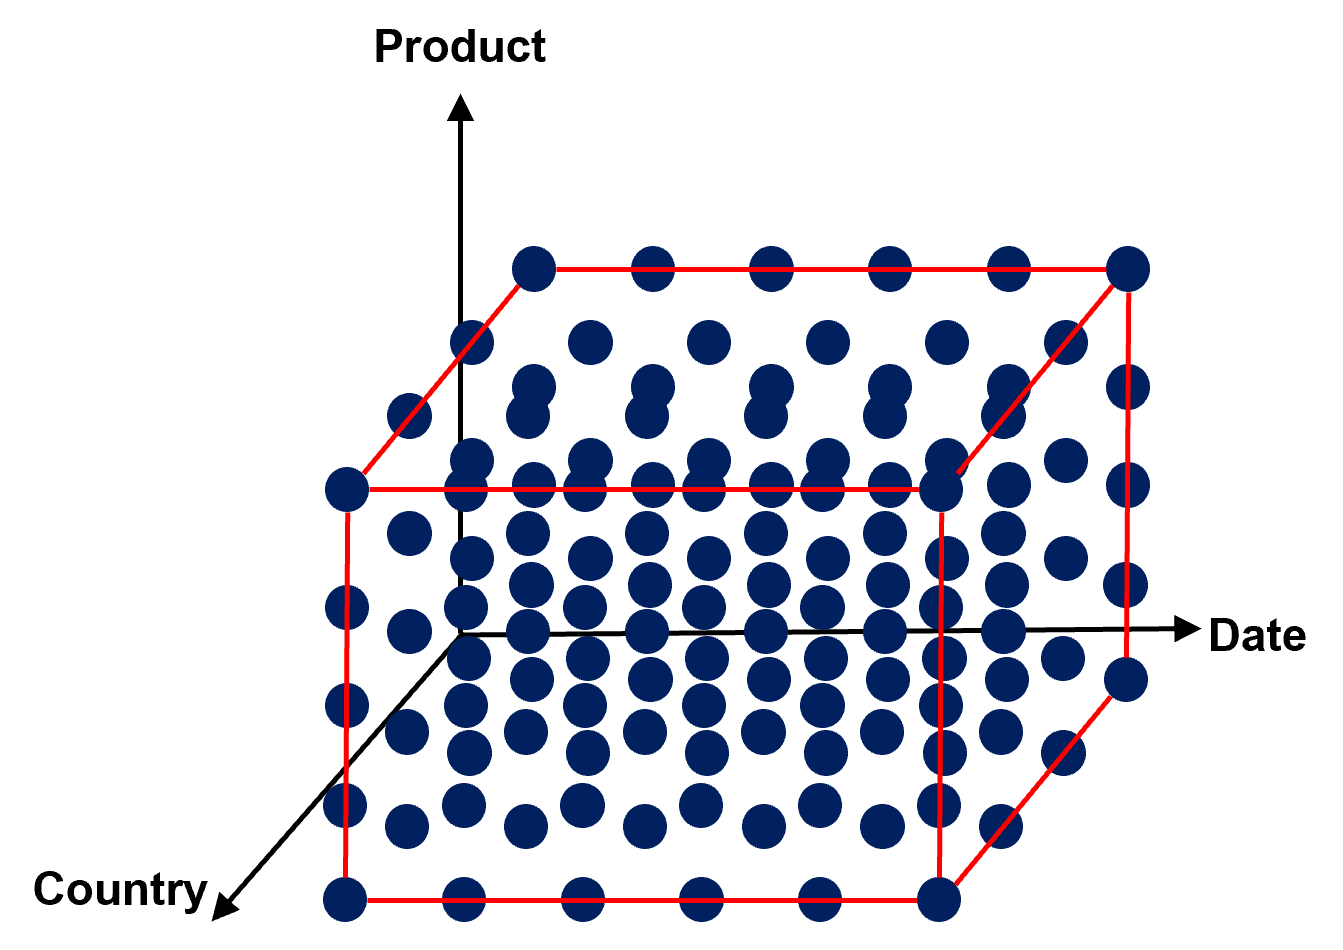
1 – For the rest of the post, we will change the way we represent data.
2 – We will transpose the table and then, imagine that each table value forms are a blue dot.
3 – We can arrange them along three axes.
4 – After that, since you understand the principle (I hope), we can erase axis values and add data. Now it really looks like a cube.
A hypercube works on the same principle, except we are talking about a cube with more than three dimensions. With our representation shortcut, we can easily represent the hypercube. We can add a dimension in the data, for example, customers. The result will be as follows:
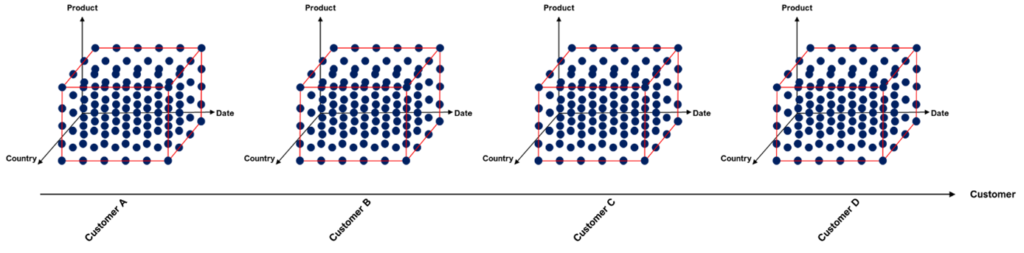
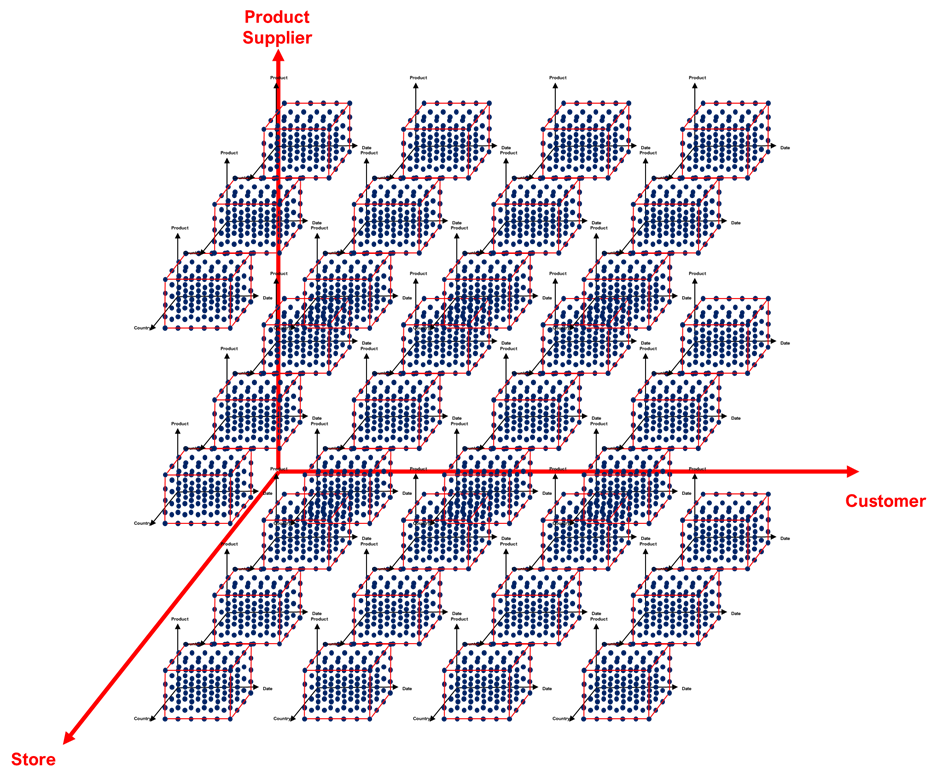
And for fun (everyone has their passion), we can add dimensions like “Store” and “Product Supplier”, welcome to the matrix.

3 thoughts on “How to Visualize a 4d Hypercube?”