There are three major data warehouse design techniques : the star schema, the snowflake schema, and the data vault. This is the first post in a series within which we will compare the operational impact of each one. We will start with a star schema by designing an example of a physical data model. Additionally, we will explore the transformations to apply in order to load data.
Data example presentation
Master data

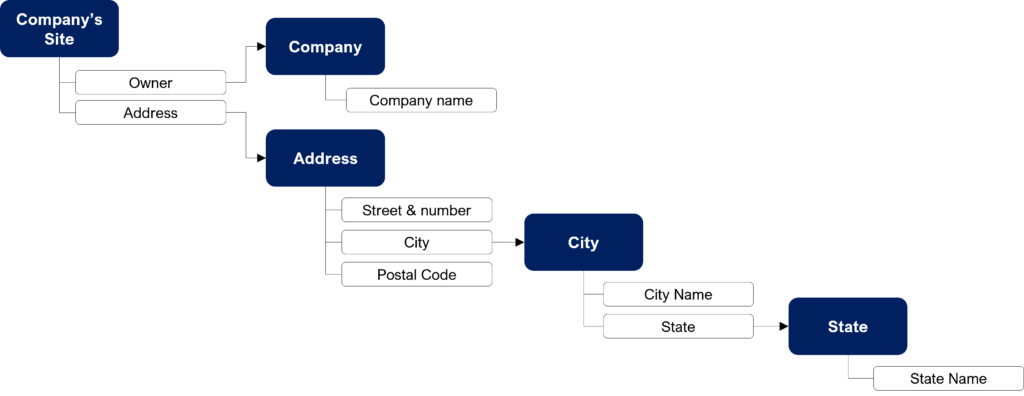
We begin with the company scope of our example. We describe a company by its object and its sites. A company can have more than one site, that’s why we see a link from the site to the company. Additionally, we give a name to the company.
Then, we add an address to the company’s site. But, to complicate the model, we design a geographical hierarchy with cities and states.
Transport data
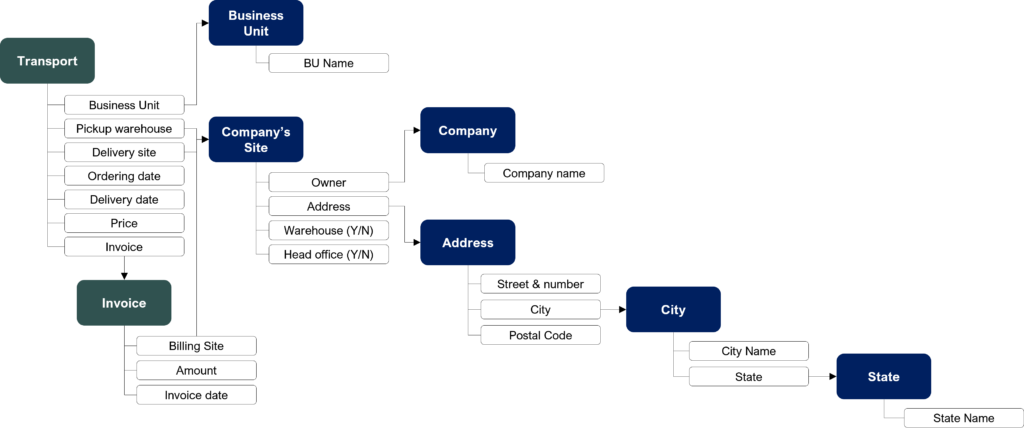
Now that we see our master data model, we can design transactional data. First, we add the transport concept, then we change the color to designate it as a business event. We add the following information to our model :
- In the transport concept
- Pickup warehouse: where the goods come from, this is a company site. That’s why we see the link with the company’s site object.
- Delivery site: where the goods must be delivered, this is a company site (imagine that we work in a B2B context)
- Ordering date: the date of the order creation
- Delivery date: the date of the transport execution
- To finish, we add another object, the business unit. It will help us to fully understand our star schema example.
- In the company’s site:
- Warehouse (Y/N) : to tag a site as a warehouse. We can imagine the following business rule in the transport: “A pickup warehouse must be a warehouse site”
Billing data
Finally, we add the billing, another transactional data. We imagine that customers are billed each month. All transport executed in the month is part of the bill. To this end, we add the following information to our model:
- In the bill concept:
- Amount: the price sum for all transport concerned by the bill
- Billing date: the invoice creation date
- Billing site: the customer’s site where the invoice has to be sent. This site must be a head office.
- In the transport concept
- Invoice: we imagine that customers are billed each month, this link allows us to model it.
- In the Company’s site concept:
- Head Office (Y/N): to tag a site as a warehouse. We can imagine the following business rule in the invoice: “A billing site must be a head office”
Corresponding star schema
Master data denormalization
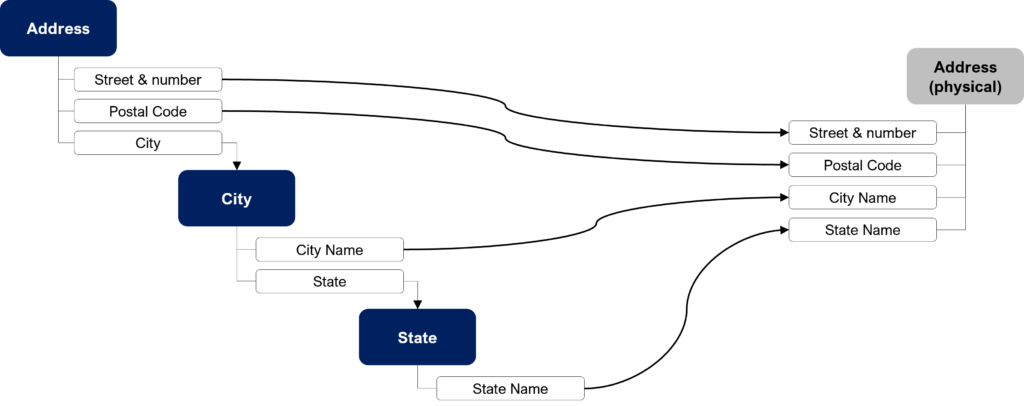
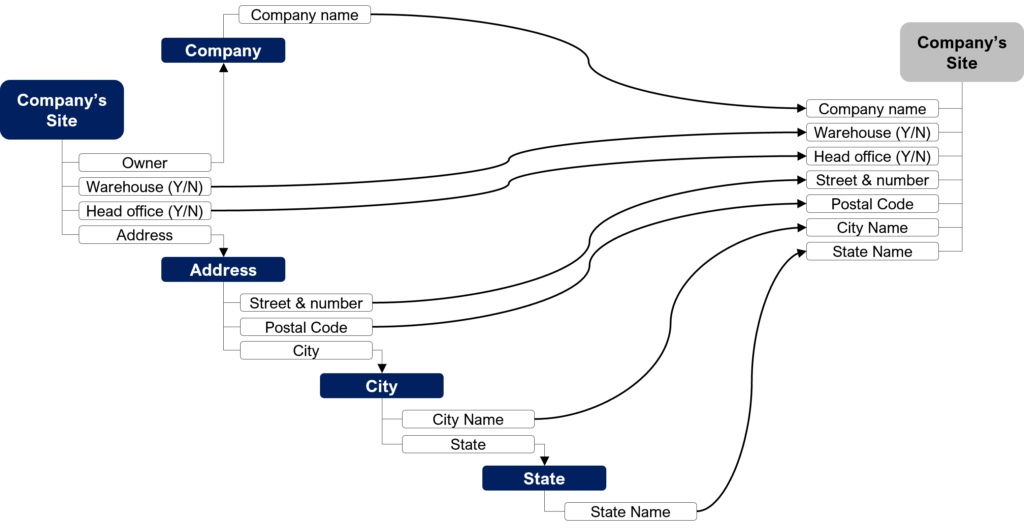
To build the star schema, we use de-normalization. It consists of combining several tables linked by references into a single table. Firstly, let’s do it for addresses. It is correct to suggest the following physical data model:
Secondly, we can apply the denormalization to the company’s site:
Time denormalization
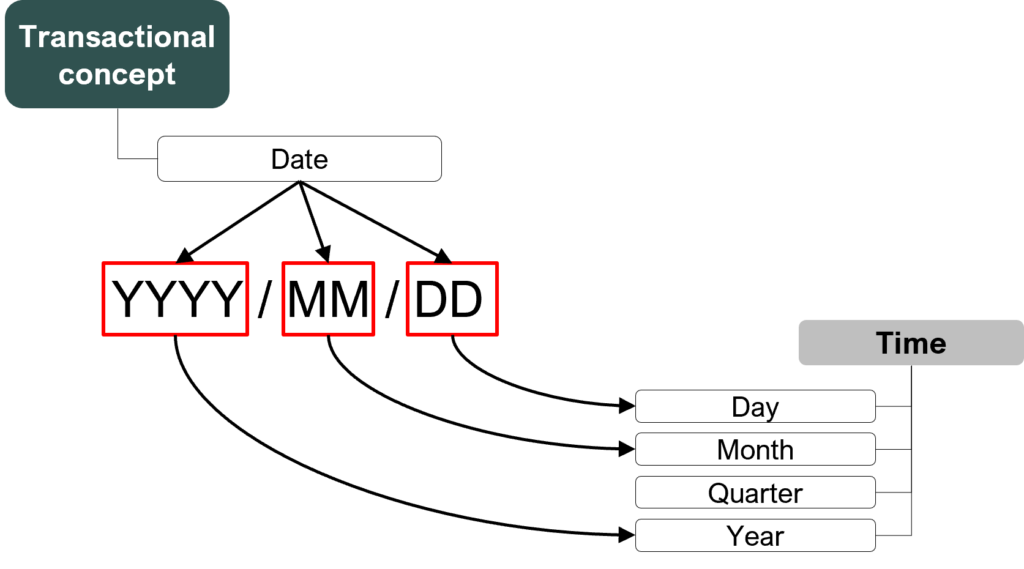
Time is the last object we didn’t talk about. It is a standard model that any star schema contains. The idea is to decompose a date into its day, month, and year. You can add quarter, weekday flag, weekend flag or other time periods you want to see in your reports. Then, the objective is to generate a link between each date component and its corresponding reference.
Resulting star schema
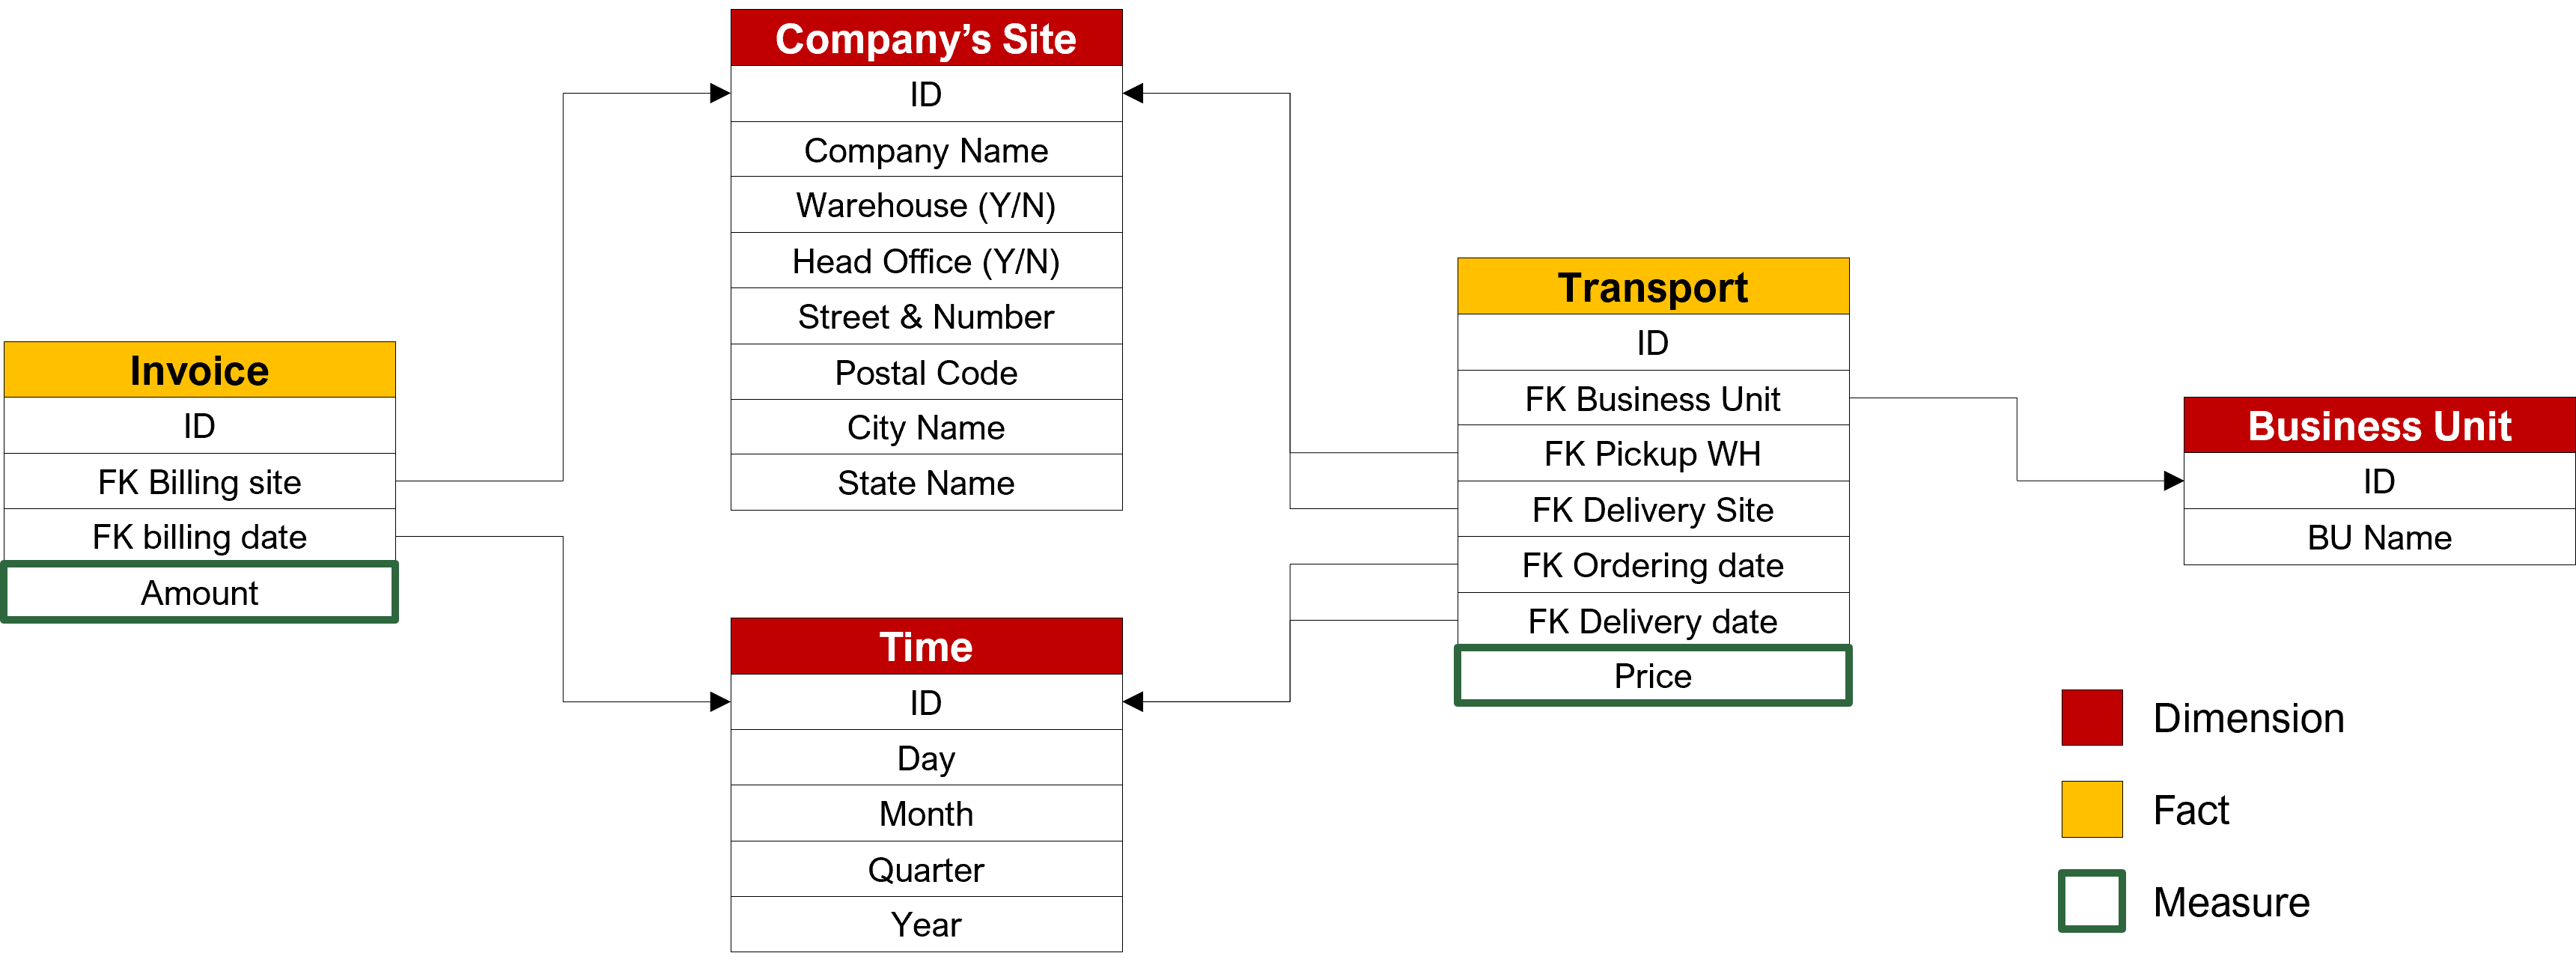
We are now able to design the star schema for the transport example and give its key concepts:
- Measure: Measures are the information to be aggregated in indicator display. Here, we give the price as an example. This means users will be able to run reports on this information.
- Dimension: Dimensions will be an available analysis axis for users. In this star schema example, users will be able to analyze the price by business unit and customer in time.
- Fact: Facts tables are the link between measures and dimensions and time.
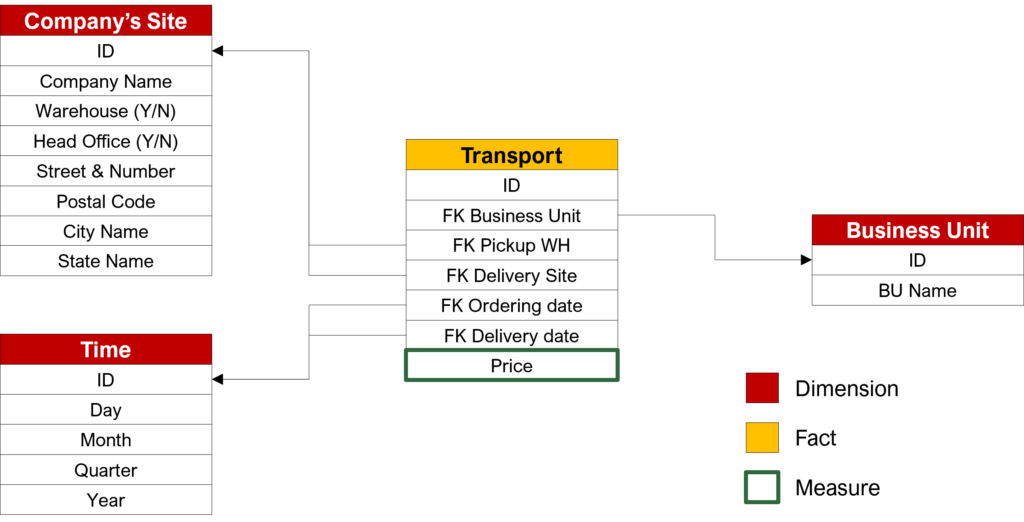
We are now able to generate the cube.
Constellation schema
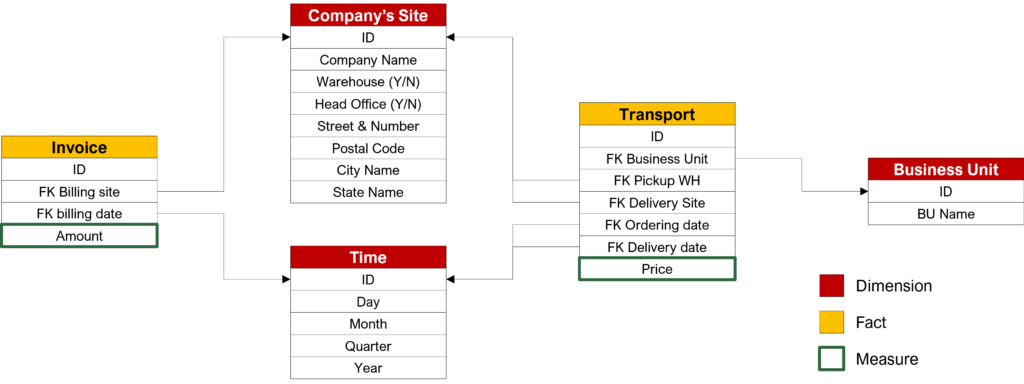
Finally, there is a last concept we can talk about, the constellation schema. In our star schema example, we can add the invoice by using existing dimensions. It allows us to run cross analysis on transactional data.
Note : The transformations you see in the previous schema are typically executed by an ETL tool like Pentaho PDI or Talend data integration.

2 thoughts on “Star Schema Example”
Comments are closed.