After writing a post on business intelligence project building blocks, we wanted to talk about tools that allow to execute it. One of them is Pentaho (a Hitachi Group Company). We like it because the community edition offers a complete set of features that allow to take in charge of all building blocks.
You can download it here. Regarding the installation, there is a user guide available as well as a lot of blogs or Youtube videos that explain how to install it (you will need to install java first, that’s why it is a little complicated. Don’t worry, you will only have to do this once)
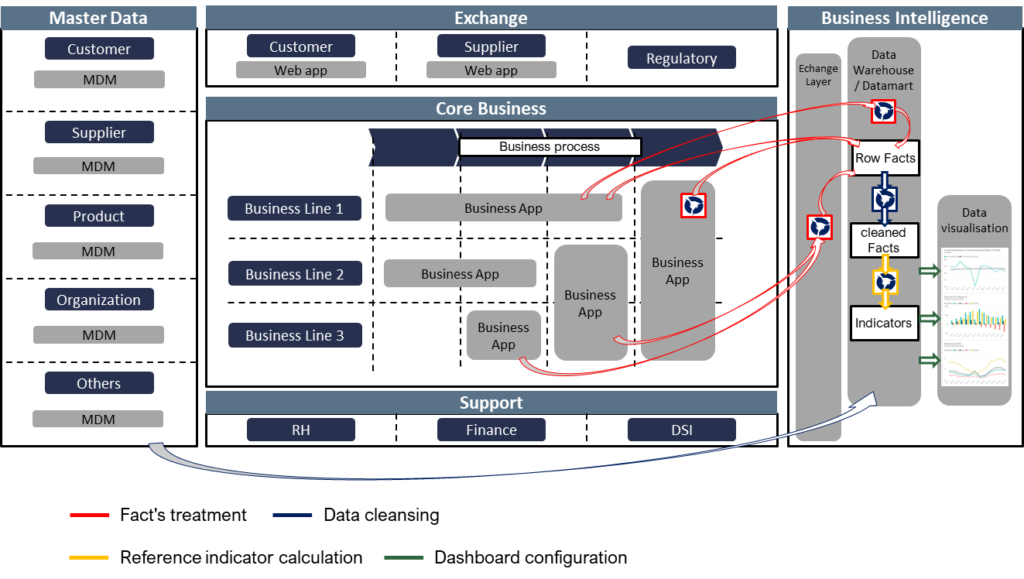
In this post, we will review the different modules of this suite and explain their roles in a business intelligence project. To do this, we use the following building blocks:
Pentaho User Console – PUC

We begin with the end. The PUC module is the front (what the end users see). It allows you to configure and visualize data. This is the dashboard configuration in our BI building blocks.
Additionally, the PUC module allows you to define a schedule to run reports at regular intervals and users administration features to assign their permissions.
Pentaho user console is web-based, which means that you need to install and run the Pentaho server to use it.
Explained like this, it sounds great. But to run reports and dashboards, you need data stored in a specific format. This is the next module’s role.
Pentaho Data Integration – PDI
The PDI module allows to take charge of the ETL block (the fact treatment and the data cleansing in our BI building blocks). Its role is to :
- Extract: get data from different sources
- Transform: adapt these data format to the target database
- Load: record data in this target
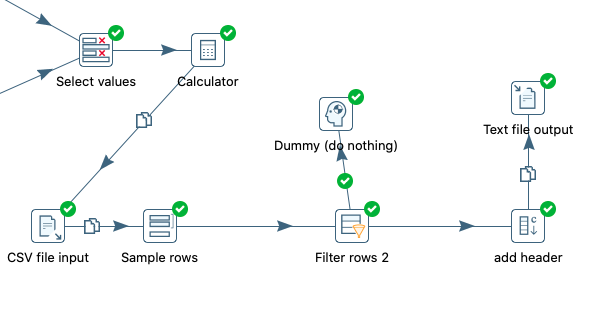
PDI has all the must-have features of the ETL block and extras. The tools allow you to design data flows in drag and drop mode:
- Extraction features: to extract data from files or databases. Specific connectors are available too, this makes it possible to easily connect PDI to major vendor tools like Salesforce, Microsoft Access, and so on.
- Loading features: to insert data in the target, you will find extraction features equivalent connectors.
- Streaming: to design real time data flows. Besides a standard connection, you will find specific connectors like Kafka and jms.
- Big data connectors: with specific connectors to Cassandra, Hadoop, MongoDB, etc.
- Transformation features: this is the richest scope, it is impossible to list everything here. If one day I find a transformation type that is impossible to do with Pentaho, I will mention it here. Even fuzzy match features are available, this is very rare in an opensource tool.
- Steering: to manage your data flows with indicators, alerts, and orchestration features.
Pentaho Schema Workbench – PSW
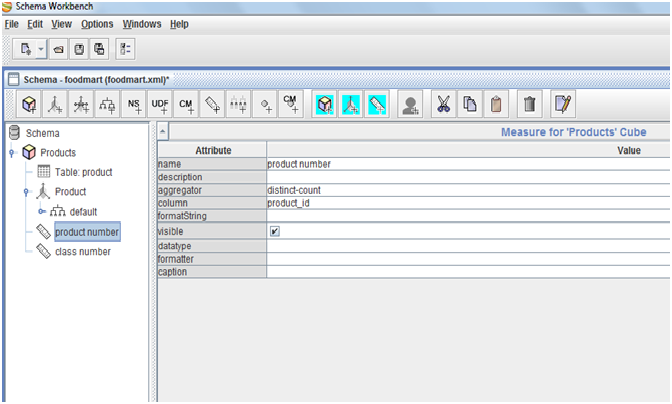
Analytics tools need a cube (stored in an OLAP database) as an input. The PSW module allows you to design an OLAP database on the basis of your data warehouse (which is a relational database – for example with MYSQL). Additionally, PSW makes it possible to do some aggregation like sum, average, min or max. PSW allows to take charge of a part of the reference indicator calculation scope in our building blocks.
However, PSW doesn’t allow you to visualize the content of your cube, it just converts data. You will need an analytics tool like Pentaho user console to do this. We are strating to see the sequence from source database to dashboard via PDI and PSW, but there is a step missing, the aggregation.
Pentaho Aggregation Designer – PAD
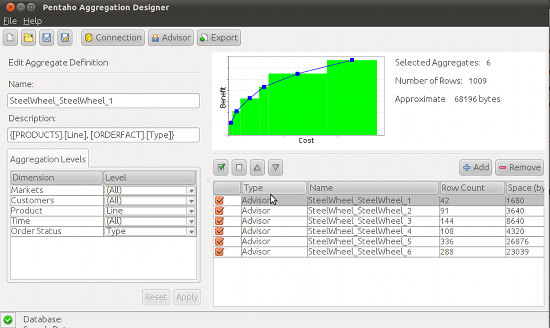
The PAD module allows you to enrich your cubes with aggregations. In the PSW, you will be able to design the cube structure and indicate where to find measures in the database. The PAD allows you to generate data with different granularity. For example, the data warehouse will give you each sale, aggregations will give you sales by day, by product, or by day and product. PAD supports the indicator calculation in our building blocks.
Additionally, you will find the following features in the PAD module:
- Managing data aggregation performance is a real challenge, that’s why the PAD module offers you some features to check your aggregations resources consumption.
- Once your aggregation is designed and tested, you can export the script and integrate it in PDI to execute it regularly and automatically.
Pentaho Report Designer – PRD
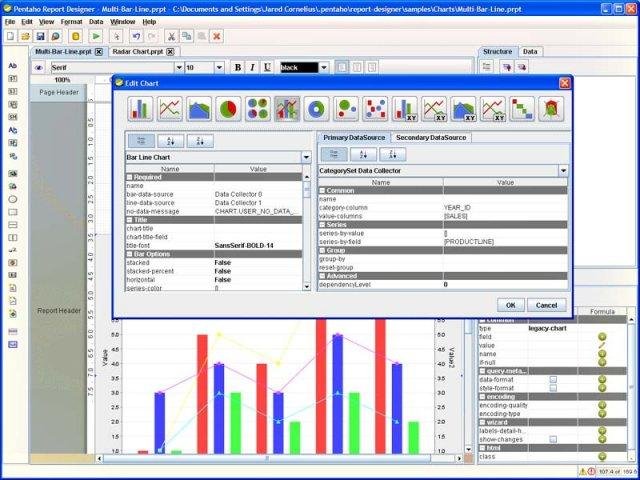
The PRD module allows you to design operational reporting. Just a warning, this is not business analytics. The PRD does not allow end users to “manipulate” data on demand, it generates document reports (like word, pdf, etc.) on the basis of fixed templates.
The PRD module is able to get data from the data warehouse (relational) or the cube (OLAP). With these capabilities, you will be able to export a list of data and graphics in your reports.
Most PRD functionalities allow you to design your report using drag & drop, but you will need to write a database request to get data.
Pentaho Metadata Editor – PME
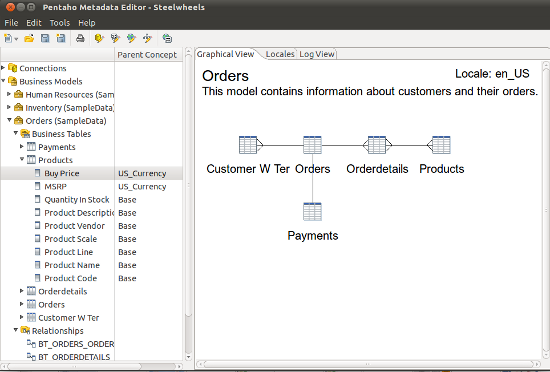
The PME module allows to define a business semantic on the physical data models. Databases fields and table names can be a little complicated because of technical constraints (like product_name, DB01_BPK_TYPE or DWH_CUSTOMER). It can be tedious and sometimes unusable for end users. The PME module solves that. It allows you to redefine labels and map them to technical ones.

One thought on “Pentaho Community Edition Review”
Comments are closed.