A business intelligence project basically consists of allowing users to visualize data or summarize activity performance. It is impressive to compare the cost rate between the end-users’ functionalities and other components to design. In my opinion, it is around 80% if the legacy is well designed. In this article, we will give an insight of this rate by exploring business intelligence project macro .
First Building Block: Where is the information stored?
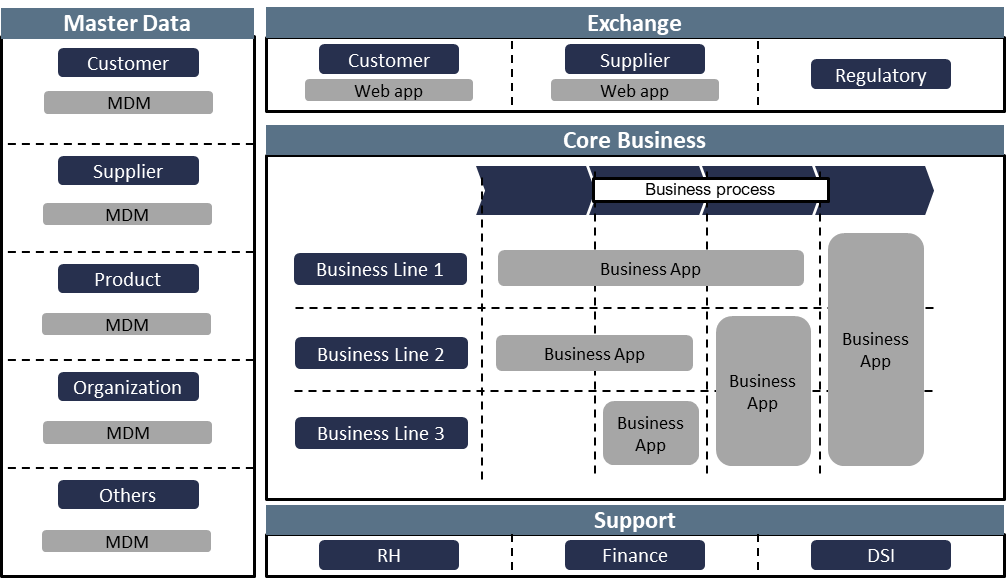
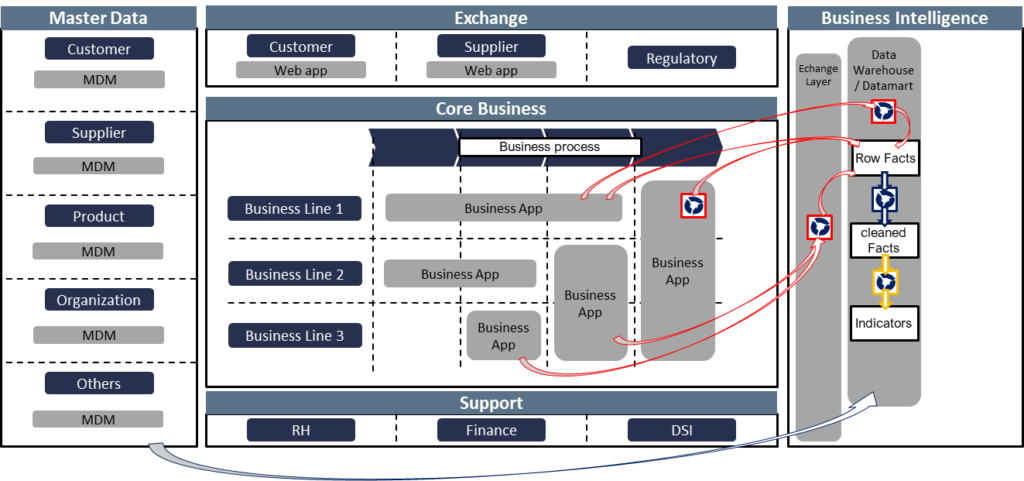
To generate a dashboard for users, it is obvious that you must get business data. I frequently use this schema to sum up the business data cartography, which consists of the following zones:
- Core business zone: In this zone, you will find applications that allow to execute core business processes like ERP, CRM, TMS, and so on. These applications generate the majority of business events.
- Exchange zone: Here, you will find business events too, but it mainly concerns the interactions with third parties (customer, supplier, bank, government). In this zone, we generally get the interaction (the contact) with customers and suppliers. Most of the other information stored in this zone is stored in the core business zone as well.
- Master Data zone: In theory, you should find the best structure of your master data in this zone. It frequently happens that the master of this data is a business application, which will be a problem if there are multiple “masters.” This is frequently the case when your company and your IT systems are sorted by business line.
- Support zone: This zone must be managed as the core business zone except you will find support business processes in it. It means you will find business events in this zone.
All applications that contain data needed to generate dashboard indicators will have to be plugged to your business intelligence systems.
Second Building Block: Business event conversion to facts and storage
One characteristic of business events is that they describe an action that happens in an instant. For example, when a user starts a session on your web-site, sends an e-mail, or buys a product. Most business intelligence architectures consume information in this format. But sometimes they use a consolidation of business event information for a given period (hour, day, week, etc.). For example, business intelligence architecture will not consume each email, it will consume the number of emails of the day. There are different ways to do this depending on your context and legacy architecture. Facts can be generated in:
- Business applications and then sent to the data warehouse
- Between business applications and the data warehouse in the exchange layer – ETL (not recommended but sometimes necessary, high cost)
- The data warehouse
We can represent this in our schema:
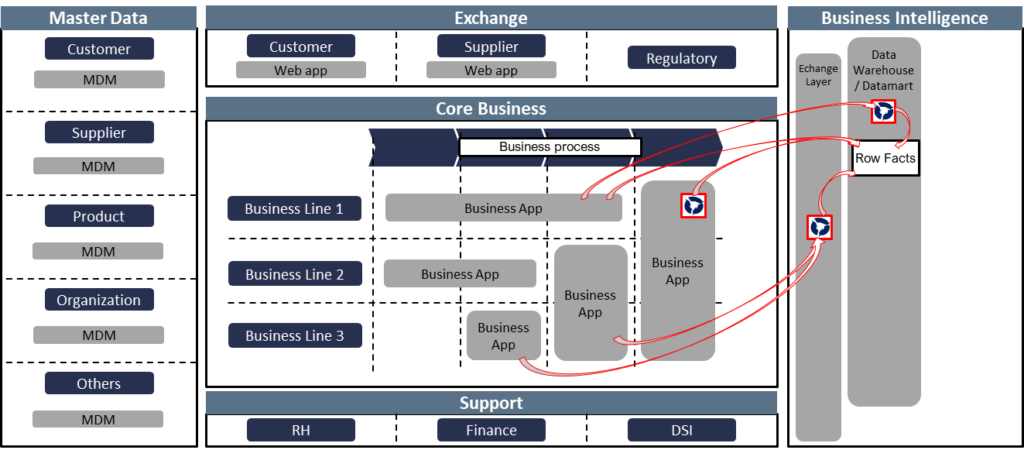
Note: As you can see, data mart & data warehouse are represented together, but we will not explain the difference between these two concepts in this post.
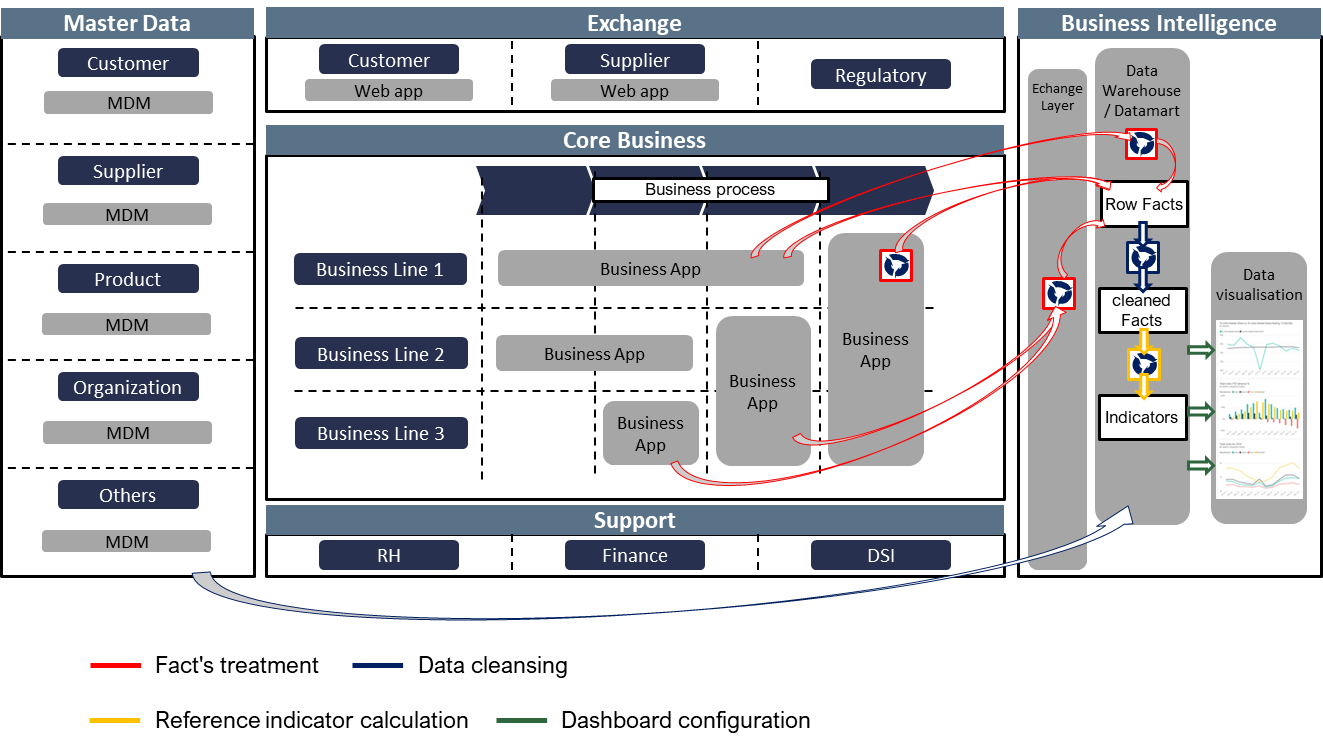
Third Building Block: Dimensions preparation
According to the business needs, business intelligence dimensions correspond to objects. As explained in the post Understand Master Data Management, the main source of difficulty is the involvement of objects in many processes. As a consequence, objects get recorded in each application database that executes a process in which they are involved. Unfortunately, the content and structure of these databases can be heterogeneous, and it generates incoherence. This makes the data control phase necessary in the data warehouse.
In conclusion, the third cost concerns:
- Master data flows
- Facts data quality control

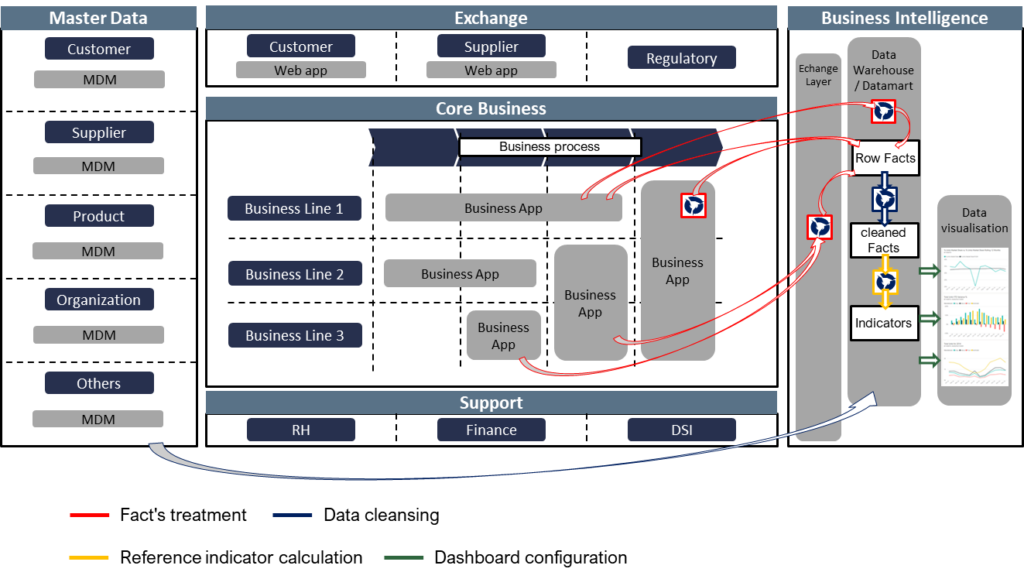
Fourth Building Block: Reference indicators calculation
Calculating a company’s profit can be complex for large companies and requires a certification, that’s why it is recommended not to design and build these indicators many times. These indicators must be calculated in the data warehouse or in a data mart. That’s what we represent in the next schema:
Last Building Block: Dashboards
And then, the last cost is the dashboard configuration: